


SMAST Estuary Water Sampling
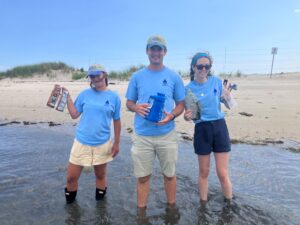
The only way to truly understand just how impaired our waters are, is by measuring water quality over a sustained period of time. This allows us to obtain and establish crucial baseline data. And our team of scientists, researchers, volunteers and collaborators does this very well.
For over 15 years, we have worked with UMass Dartmouth’s School for Marine Science and Technology (SMAST), which is part of the larger Massachusetts Estuaries Project (MEP) on water quality sampling. The MEP reports that the 1,251-acre Three Bays system that includes West, North and Cotuit Bays exceeds a critical threshold for nitrogen that is harmful to water quality, human health, and is toxic for wildlife including fin and shellfish, and plant life. We collect water samples to be tested for nitrogen, as well as other impactful nutrients like phosphorous, chlorine and potassium. Although not required by the MEP, Three Bays also takes samples to be tested for fecal coliform. These samples can help pinpoint suspected septic system leaks into surrounding waters.
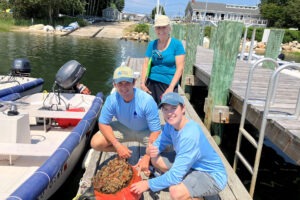
In addition to working with SMAST, since 2014, BCWC has participated in the Center for Coastal Studies’ Water Quality Monitoring Program. We help collect data for five sites within the Three Bays system, testing for temperature, salinity, turbidity, and a wide variety of nutrients.
Water quality sampling page north bay nitrogen and phosphorous chart
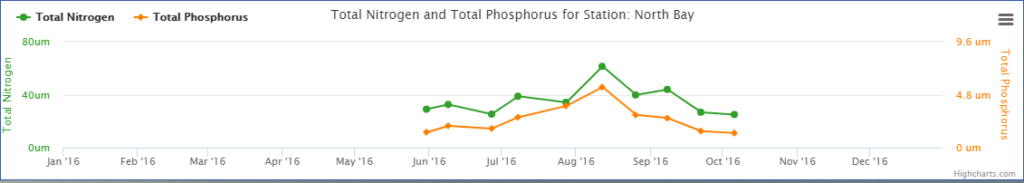
2016 nitrogen and phosphorous sampling data from North Bay, which shows the impact Cape Cod’s seasonal population has on nutrient levels in our embayments.
If you are interested in up to the minute data, the Cape Cod Cooperative Extension monitors Cotuit Bay water quality with a YSI Sonde Device.
Data from this device is transmitted every 15 minutes and can be viewed here:
Water Quality Monitoring Parameters Measured:
Temperature
Temperature is recorded as it is often one of the most important factors influencing the growth of marine and aquatic organisms. Many other water quality parameters and biological processes may also be influenced by temperature. There is also evidence that certain parasites and other potential pathogens to fish and shellfish vary in abundance according to physical properties like temperature and salinity. The temperature can be recorded in both Fahrenheit (F) or Celsius (C) and converted using the following conversion equations: °F = (1.8 x °C) +32 and °C = (°F-32) x 0.555
Salinity (ppt = parts per thousand)
Total Dissolved Solids (g/L)
Total dissolved solids (TDS) is the amount of dissolved solids in a certain volume of water. This parameter is related to the amount of dissolved salts and minerals in the water.
Conductivity (mS/cm)
Conductivity is the measurement of the ability of water to carry an electric current. Conductivity is used to help determine TDS and salinity values. After the specific conductivity reading is obtained, it is used in an equation to calculate salinity and TDS. As conductivity increases so does the salinity and TDS.
Depth (m)
Conductivity is the measurement of the ability of water to carry an electric current. Conductivity is used to help determine TDS and salinity values. After the specific conductivity reading is obtained, it is used in an equation to calculate salinity and TDS. As conductivity increases so does the salinity and TDS.
pH
In scientific terms pH stands for “potential hydrogen” which is an overall measure for the acid/alkaline balance. The pH level is measured on a scale from 0 to 14 where 0 is the highest acidic concentration and 14 is the most alkaline. The pH of a body of water or solution is determined by the hydrogen ion concentration activity and is expressed mathematically as pH = -log [H]. It is important for pH to remain at a balanced level for marine life as changes can affect physiological processes like the ability to utilize oxygen and quickly induce stress. The average pH of ocean surface water is approximately 8 but varies with environmental circumstances and location. Ocean acidification, or a decrease in pH, has become an increased concern over the past decades as increased atmospheric carbon dioxide is dissolved in the oceans, further warranting the long-term observances of pH levels.
Dissolved Oxygen (DO or ODO)
Dissolved oxygen (DO) is an important parameter to measure because it strongly characterizes the health of a water body as a necessary element for marine life. DO is measured as the amount of gaseous oxygen (O2) dissolved in water, and is measured by the YSI sondes in both percentage saturation (%) and milligrams per liter (mg/L). Algae normally produce oxygen through respiration such that measured surface DO levels are often higher during daylight hours. A low DO level may indicate high levels of decaying algae and/or waste products. Low DO levels could also be the result of warmer water temperatures as the oxygen capacity of water is inversely correlated with water temperature, i.e. as water temperature increases the DO saturation level of the water decreases. Depending on the particular probe used the DO will be expressed as DO or ODO (optical dissolved oxygen).
Chlorophyl
Chlorophyll is a pigment that is responsible for photosynthesis in plants. Obtaining a chlorophyll concentration measurement is a way to estimate phytoplankton levels as chlorophyll is directly linked with the amount phytoplankton or algae suspended in the water. Phytoplankton consume available dissolved nutrients and carbon dioxide with the aid of sunlight during photosynthesis, which results in energy for the algae and oxygen which is released to the surrounding water. Understanding phytoplankton populations and their distributions can help understand the health of a water body, as the algae serve as a base food source for the ecosystem, but may also indicate conditions of eutrophication as nutrient levels start to overload the system. Higher levels of algae (chlorophyll concentration) can cloud the waters so that the bottom is shaded, hampering photosynthesis by submerged vegetation and decreasing dissolved oxygen available at the bottom. Also, as algae bloom in eutrophic conditions then settle and decay on the bottom, oxygen is used by bacteria consuming the decaying algae decreasing further the available oxygen.
Turbidity (nephelometric turbidity units or NTUs)
This measurement reflects the amount of suspended solids in the water, or the overall clarity or cloudiness. If the water is cloudy it may indicate increases in the amount of suspended particulates. Sometimes the suspended particulates can direct us to potential situations causing change in turbidity readings such as coastal erosion, runoff, waste discharges, and planktonic organisms. Increased levels of turbidity will often impede light transmittance through the water which is of importance to submerged aquatic vegetation like sea grasses, which provide habitat to a multitude of species.